There are two big things happening in the Middle East that have got the whole international community on edge. The regime in Syria suddenly collapsed, and then Saudi Arabia immediately announced a 34% anti-dumping duty on imports from China.
Recently, the General Authority for Foreign Trade of Saudi Arabia announced that it would impose anti-dumping duties on imported sulfonated naphthalene formaldehyde (SNF), which is a concrete improver, from China and Russia.
Majed Al-Qasabi, the Saudi Minister of Commerce and the chairman of the General Authority for Foreign Trade (GAFT), announced this decision and it was published in the official gazette.
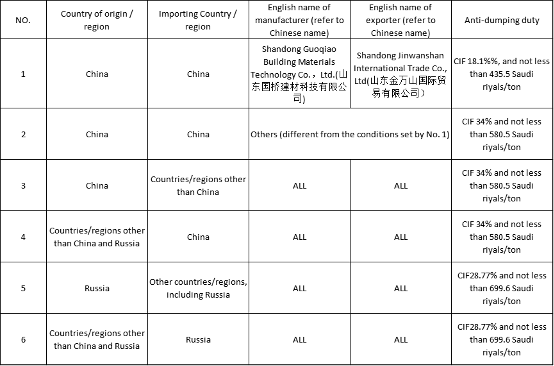
Saudi Arabia has said that starting from December 3, 2024, it’ll charge an anti-dumping duty ranging from 18.12% to 34% on the imports of sulfated naphthalene formaldehyde (SNF), which is a concrete improver, and that comes from or is exported from China and Russia. The Saudi tax numbers for the product are 382440 and 290410, and this will be valid for five years.
Attached table: Saudi Arabia on sulfonated naphthalene formaldehyde concrete modifier anti-dumping final ruling tariff table
Saudi Arabia stated that the decision was issued based on the International Trade Remedy Law to protect domestic industries from the damage caused by unfair trade practices.
As these low-priced goods have brought huge pressure to local Saudi producers, especially in the context of the rapid development of the construction industry, the Saudi government believes that if no intervention is taken, the survival space of domestic enterprises will be further compressed.
The imposition of anti-dumping duties aims to raise the price of imported goods, thus giving local producers a greater share of the market and more favorable profit margins.
The market size of sulfonated naphthalene formaldehyde is gradually expanding, especially in the Middle East, as the construction industry in Saudi Arabia, the United Arab Emirates and other countries continues to develop, the demand for sulfonated naphthalene formaldehyde also shows a strong growth trend.

Saudi Arabia has always been an important partner of China in the Middle East. From energy import to infrastructure construction, the relationship between China and Saudi Arabia has been regarded as a model, and China’s infrastructure investment in Saudi Arabia will ultimately benefit the Saudi people. Saudi Arabia is also hurting itself by imposing tariffs.
Of course, this does not mean that the relationship between China and Saudi Arabia has broken down. To counter Israel, Saudi Arabia still needs to import some sophisticated weapons from China that the United States bans. This is the foundation of cooperation between the two sides, but also the reality that cannot be changed.
But the Saudi move has also raised alarm bells in China. In exchanges between countries, national interests should ultimately come first.